Groundwater Quality

Groundwater Management Plan

In 1987, Central Platte NRD’s Groundwater Quality Management Program was the first in the Central Platte Valley to address widespread high groundwater nitrate problems by implementing a long-term, common sense management approach.  The Groundwater Management Plan was updated in May and took effect on July 1, 2023.  To align with the new Plan, the Rules & Regulations were approved at the November Board meeting and effective December 24, 2023.

NEW Plan        Maps         RULES & REGULATIONS

New Water Quality Triggers
Phase I:     0-7.5 ppm
Phase II:    7.6 - 10.0 ppm
Phase III:   10.1 ppm & above
Phase IV:  An area where nitrate concentrations are not decreasing

UPDATED MAPS of each Phase Area available at http://cpnrd.gisworkshop.com 

*COMING SOON...Producer Connect App  Read more...


Management Plan

Irrigation/Nitrogen Management Program

Private Well Sampling
Nitrate contamination can impact our health and is a growing concern for private well owners. This video provides step-by-step instructions on how to test your drinking water for nitrate to ensure it's safe for you and your family.

Water samples collected annually across the Central Platte NRD assist in the evaluation of nitrate levels, the primary contaminant of concern. Irrigation well samples are gathered by District staff, in accordance with Quality Assurance Quality Control (QAQC) standards and submitted to the statewide database (Nebraska Groundwater Quality Clearinghouse). Internally, nitrate data is monitored and shared with the Board of Directors, therefore, directing management actions and education outreach efforts.


Nitrate levels in groundwater are showing declines in some parts of the District, however, many parts are still well above the recommended 10 ppm drinking water standard. Producers in Phases II/III of the Groundwater Quality Management Program are required to submit an annual crop report form along with water and soil samples. The management program requires samples in these areas to provide the NRD with producer-driven data to analyze and refine water quality management decisions. Producers who do not submit the report forms are in violation of the CPNRD Rules and Regulations and are issued Cease and Desist orders. Potential penalties for violation are: fines ranging from $1,000 - $5,000 per violation per day and/or loss of irrigated acres, ineligibility for NRD cost-share and restriction from transferring irrigated acres.

Nitrogen Management Program reports are due March 31st for all crops in Phase II & III Nitrogen Management areas and must be entered on the District’s online crop reporting form. The March deadline was set to allow producers to utilize UNL’s nitrogen recommendation for the upcoming irrigation season; which produces a recommendation for each field as users enter their data.  Crop Form

The two-page report includes:
*Legal description of well(s) irrigating each crop, # of acres of each crop
*User name/password. If crop consultant/fertilizer dealer completes form, provide username/password to them.
Page 1: Previous crop(s) grown, actual yield, fertilizer applied, water usage.
Page 2: Crop(s) to be grown, expected yield, irrigation info, soil/water test results, legume or manure/sludge credits

Water & Soil Tests
Producers planting corn, grain sorghum, or potatoes are required to take deep soil & groundwater samples for Nitrogen to include with the annual report. The form will ask the expected yields and credits for past legume crop and manure or sludge. UNL’s recommended nitrogen application rate will appear as the data is entered.
Water Samples  The groundwater analysis for nitrogen content should be taken on each field. Water sample bottles are provided by your agronomist, crop consultant, or lab.
Soil Samples  The deep soils analysis for residual nitrogen (NO3-N) must be taken on each field or 80-acre tract. The composite sample tested must consist of a mixture from no less than one three-foot probe every five acres. The report from the lab must be attached to the annual report.

Non-Compliance
Violations will be enforced prior to the irrigation season. Cease and Desist Orders will be mailed to producers who fail to complete and submit forms by the March 31st deadline. Potential penalties for violation are the possibility of a fine ranging from $1,000 – $5,000 per violation and/or loss of irrigated acres, ineligibility for NRD cost-share, and restriction from transferring irrigated acres.  In July 2022, nine producers remained out of compliance for the Groundwater Quality Management Program. Three of the nine producers violated Cease and Desist ordering by irrigating without getting into compliance with the CPNRD. The violations will be turned over to the NRD’s legal counsel. CPNRD has over 850 producers in Phase II/III areas who are required to submit annual reports.

Taxpayer $$ Spent on Water Quality Violations
As part of the Ground Water Management Program, certified violation letters are sent to producers and landowners in Phases II/III who are in violation of the NRD’s Rules & Regulations. Violations occur when annual crop reports are not submitted and/or water and soil samples are not provided. As a local government entity, the NRD receives local property taxes. The cost of these letters and legal fees for those who do not comply is paid for by taxpayers in the District. An average cost to taxpayers each year is over $17,000. Breakdown of costs:
Mail: $450/year for regular mail & certified postage    Staff Time: $2,000     Legal Fees: $14,890     Average Annual Total: $17,340

Nitrogen Certification

Nitrogen certification is valid for four years. Producers with certification expiring will receive a certification test to be completed and returned to the CPNRD office. Certification from other districts is accepted and producers who attend CPNRD’s annual Water Programs Update are not required to complete the test.

Your Contact Tricia Dudley  (308) 385-6282  dudley@cpnrd.org

Labs for Water & Soil Sampling

How to Sample Your Well
Sampling your well at least once a year will give you a good representation of the aquifer at the well location. Always contact the lab before sample collection since different water tests often require different methods of collection and delivery. Lab staff may suggest specialized water tests based on your location or needs. Water quality data are only as good as the water samples from which the measurements are made. The following collection steps are general, be sure to contact your lab for specific instructions to prevent contamination and improve accuracy.

1.   Label your sample bottle(s) with a permanent pen. Include where the sample is being collected, either address or owner’s name.
2.  Observe your well for any damage. If the wellhead is damaged, consider requesting a sterile bottle for bacteria testing and contact a licensed well driller for repairs.
3.   Locate your sampling point. An exterior faucet or hydrant closest to the well is best.
4.   Allow faucet or hydrant to run for 5 to 10 minutes. This ensures a fresh sample from the well.
5.   Avoid contaminating your sample. Carefully remove the cap and do not touch the inside of the bottle.
6.   Proper Storing: Fill the bottle and store it in a cooler with ice or an ice pack.
7.   Deliver sample to the lab. See local lab information below.

Sampling once a year will help you observe trends and give you insight into filtration needs. Be sure to collect a sample after wellhead damage or repair and major flooding. If you have a reverse osmosis filtration system in your home, consider testing the filtered water and the unfiltered water. Reverse osmosis filters need to be changed regularly to maintain effectiveness. Comparing the two sample values will provide a good indicator of how that system is working.


Your Contact Tricia Dudley  (308) 385-6282  dudley@cpnrd.org

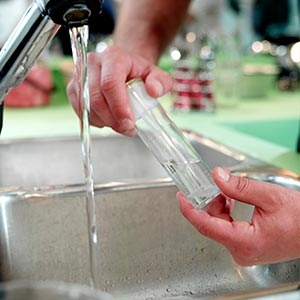
Why It’s Crucial to Sample Domestic Wells

Many rural homes in Nebraska have a private well rather than water supplied and treated by a municipality. Groundwater quality differs greatly throughout the state. Your home may have completely different water issues than your neighbor down the road. That’s why it’s crucial to test your water at least once a year to reduce health risks and ensure that your family has good quality water. The safety and
quality of the water is your responsibility when you have a private well. Well water may require some softening and filtration to make it ideal for drinking, cooking and cleaning. Here are other things you should know.
1.  Well Water is Groundwater that is Untreated   Groundwater is essentially rain that has moved through the soil and into the aquifer, likely absorbing a lot of other things along the way that could contaminate it.
2.  Water Stains/Smells  Stains in sinks, tubs and toilets may be lime scale due to hardness, however, more severe stains from well water come from high iron content. Iron is not a safety concern, but it can change the taste of your water and cause orange stains that are difficult to remove. The only way to prevent stains is to install special iron filtration systems that can also filter out sulfur, which usually has the smell of rotten eggs.
3.  Nitrates  Nitrate is the most common chemical contaminant in the world’s groundwater and aquifers, including the CPNRD. Several communities have levels higher than EPA’s recommended maximum contaminant level of 10 parts per million (ppm). A reverse osmosis (R.O.) system is recommended to treat water contaminated with nitrates. Nebraska farmers rely heavily on irrigation and Nitrogen fertilizer to grow millions of acres used in the global food supply chain; however, nitrogen that doesn’t get used by the crop ends up in Nebraska’s streams, lakes and groundwater. The primary source of contamination is overapplication on irrigated crops over decades.

Jesse Bell, PhD and director of Claire M. Hubbard Professor of Water, Climate and Health at the University of Nebraska Medical Center has reported that Nebraska has one of the highest rates of pediatric cancer in the nation. UNMC and other states have found a correlation between nitrogen fertilizers, animal and human waste. The greatest exposure has been found in agricultural areas and private wells. High nitrate concentration in drinking water have been linked to Methemoglobinemia, colorectal cancer, thyroid disease and neural tube defects. Other cancers and diseases linked to high nitrate concentrations: kidney and bladder cancer, Non-Hodgkin Lymphoma, Alzheimer’s, Diabetes and Parkinson’s Disease.

SEE BELL'S RESEARCH

High nitrate levels also create problems for small communities and rural water users. When a town’s drinking water well gets contaminated, a treatment plant isn’t usually an option because of cost, maintenance requirements and land space. Communities must explore options such as drilling a new well, blending water from multiple wells together, or hooking up to another community’s water system. To achieve this, communities apply for grants and loans and/or raise water rates.
4.  Naturally Occurring Elements & Minerals in Nebraska  Because water is a powerful solvent, groundwater dissolves organic matter including minerals found in the soil and rocks.
* Calcium & Magnesium These elements are what make well water hard and usually require a water softening system. They may not have a direct impact on your health, but could result in dry, itchy skin.
*Uranium  A radioactive element found in certain kinds of rocks and soils within Nebraska’s geology. Uranium is colorless, odorless and tasteless. The only way it can be detected in drinking water is to sample for lab testing. The chronic health effect associated with long-term ingestion of uranium is increased risk of kidney damage.
*Radon  A cancer-causing natural radioactive gas that you can’t see, smell, or taste. If present in your home, it may pose a danger to you and your family’s health.
*Arsenic  Some Nebraska groundwater supplies contain arsenic in high enough concentrations to present an increased risk of chronic poisoning. Research is being done to determine the exact connections between level of arsenic, duration of exposure, exposure combined with other elements, and health effects.


Study Confirms Nitrate can Draw Uranium into Groundwater

EXPERIMENT REINFORCES LINK BETWEEN CONTAMINANTS      |     
Platte River at sunset.
Craig Chandler | University Communication

Eight years ago, the data was sound but only suggestive, the evidence strong but circumstantial. Now, the University of Nebraska–Lincoln’s Karrie Weber and colleagues have experimentally confirmed that nitrate, a compound common in fertilizers and animal waste, can help transport naturally occurring uranium from the underground to groundwater.

The new research backs a 2015 Weber-led study showing that aquifers contaminated with high levels of nitrate — including the High Plains Aquifer residing beneath Nebraska — contain uranium concentrations far exceeding a threshold set by the Environmental Protection Agency. Uranium concentrations above that EPA threshold have been shown to cause kidney damage in humans, especially when regularly consumed via drinking water.

“Most Nebraskans do rely on groundwater as drinking water,” said Weber, associate professor in the School of Biological Sciences and Department of Earth and Atmospheric Sciences. “In Lincoln, we rely on it. A lot of rural communities, they’re relying on groundwater.

“So when you have high concentrations (of uranium), that becomes a potential concern.”

Research had already established that dissolved inorganic carbon could chemically detach traces of uranium from underground sediment, ultimately priming it for transport into groundwater. But the 2015 study, which found that certain areas of the High Plains Aquifer contained uranium levels up to 89 times the EPA threshold, had convinced Weber that nitrate was contributing, too.

So, with the help of 12 colleagues, Weber set out to test the hypothesis. To do it, the team extracted two cylindrical cores of sediment — each roughly 2 inches wide and running 60 feet deep — from an aquifer site near Alda, Nebraska. That site not only contains natural traces of uranium, the researchers knew, but also allows groundwater to flow east into the adjacent Platte River. Their goal? Recreate that flow in the samples of sediment, then determine whether adding some nitrate to the water would increase the amount of uranium that got carried away with it.

“One of the things we wanted to make sure of was that we did not alter the state of the uranium or the sediments or the (microbial) community when we collected the samples,” Weber said. “We did everything we could to preserve natural conditions.”

Karrie Weber, Jeffrey Westrop and colleagues

Daugherty Water for Food Global Institute
Karrie Weber (far right) directs Jeff Westrop (second from right) and fellow Husker researchers on how to test for uranium levels in the groundwater near Alda, Nebraska.


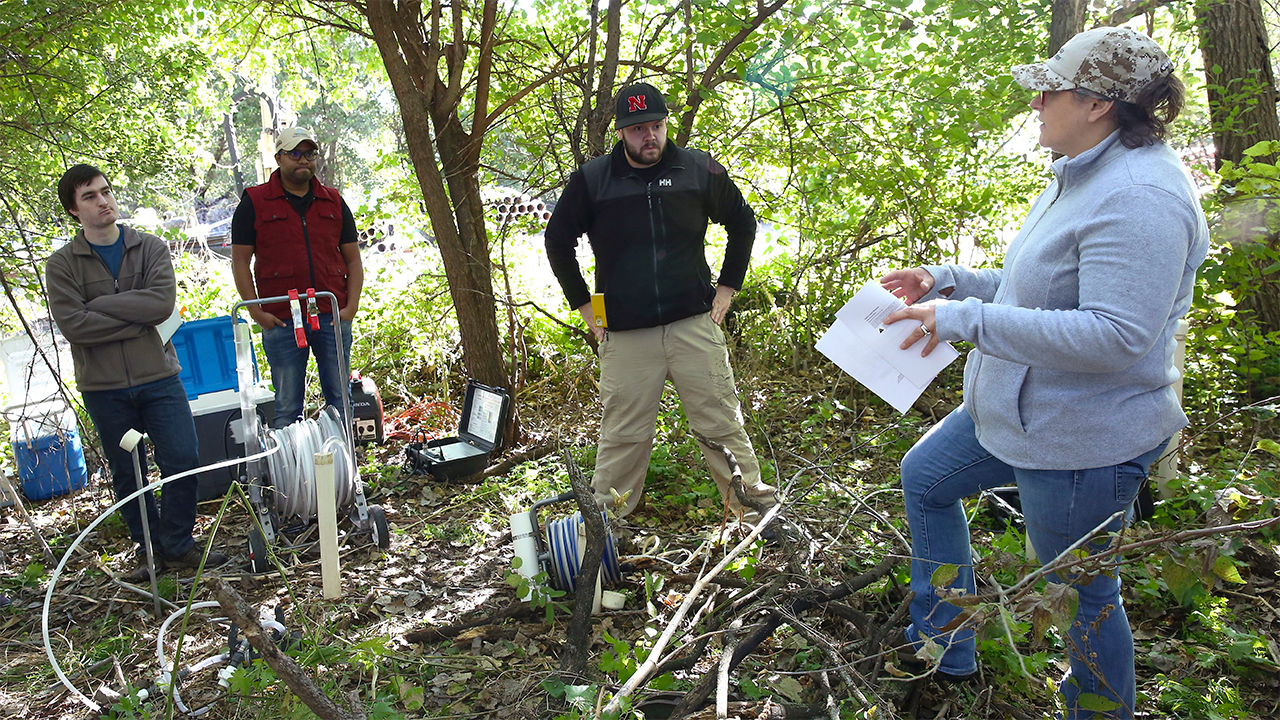
“Everything” meant immediately capping and wax-sealing the extracted cores, sliding them into airtight tubes, flushing those tubes with argon gas to dispel any oxygen, and putting them on ice. Back at the lab, Weber and colleagues would eventually remove 15-inch segments from each of the two cores. Those segments consisted of sand and silt that contained relatively high levels of uranium.

Later, the team would fill multiple columns with that silt before pumping simulated groundwater through at roughly the same rate it would have traveled underground. In some cases, that water contained nothing extra. In others, the researchers added nitrate. In still other cases, they added both nitrate and an inhibitor designed to halt the biochemical activity of microorganisms living in the sediment.

The water containing nitrate, but lacking the microbial inhibitor, managed to carry away roughly 85% of the uranium — compared with just 55% when the water lacked nitrate and 60% when it contained nitrate plus the inhibitor. Those results implicated both the nitrate and the microbes in further mobilizing the uranium. They also supported the hypothesis that a series of biochemical events, kicked off by the microbes, was transforming the otherwise-solid uranium into a form that could be easily dissolved in water. First, bacteria living in the sediment donate electrons to the nitrate, catalyzing its transformation into a compound called nitrite. That nitrite then oxidizes — steals electrons from — the neighboring uranium, ultimately turning it from a solid mineral into an aqueous one ready to surf the trickle of water seeping through the silt.

After analyzing DNA sequences present in its sediment samples, the team identified multiple microbial species capable of metabolizing nitrate to nitrite. Though that uranium-mobilizing biochemistry had been known to unfold in highly contaminated areas — uranium mines, sites where nuclear waste is processed — Weber said the new study is the first to establish that the same mobilization process also takes place in natural sediment.

“When we first got this project funded, and we were thinking about this, it was as a primary contaminant leading to secondary contamination,” she said of the nitrate and uranium. “This research supports that, yes, that can happen.”

Still, as Weber said, “Nitrate isn’t always a bad thing.” Both her previous research and some forthcoming studies suggest that nitrate mobilizes uranium only when the compound approaches its own EPA threshold of 10 parts per million.

“If we reflect upon what we published prior, that data suggests there’s a tipping point. The important thing,” she said, “is not to have too much.”

The team reported its findings in the journal Environmental Science & Technology. Weber authored the study with Nebraska’s Jeff Westrop, Pooja Yadav, Alicia Chan, Anthony Kohtz, Olivia Healy, Daniel Snow, P.J. Nolan and Donald Pan; Kate Campbell of the U.S. Geological Survey; Rajesh Singh, from India’s National Institute of Hydrology; along with Sharon Bone and John Bargar of the SLAC National Accelerator Laboratory.

RELATED LINKS

CPNRD Vadose Zone Nitrate Study

In 2016, an agreement with UNL was approved for $80,000 to revisit vadose zone core sites originally collected in the 1990s, and to determine where additional cores may best characterize nitrate storage & estimated transport rates to the water table. Core samples were collected for vadose zone nitrate including some areas previously sampled.  The three-year study of vadose zone nitrate conducted by UNL graduate student Jordan Shields compared 27 locations within the CPNRD on a variety of land uses, topography and soil type with previously cored areas in the 1990’s.

The study included nitrate storage under 24 sites including five gravity irrigated sites and 22 center pivot irrigated cropland.  Results showed a 10% reduction of vadose zone nitrate since the 1990’s; however, overall averages show vadose zone nitrate about 30% higher than the average nitrate levels under the gravity irrigated land. Vadose zone nitrate ranged from 71 to 8,860 pounds per acre of nitrate-N district-wide. Using changes in depth of nitrate concentration peaks, the transport rate (rate in which nitrate contamination travels) was determined at 0.9 to 2.5 feet per year.

The study also found several cores with over 2,000 pounds per acre of nitrate-N and significant concentrations of ammonia at depth in many locations. The report recommended further investigation of Phase II areas and in locations with vadose nitrate measuring more than 2,000 pounds per acre.

New Quality Programs

Learn More about Sensor Based Tech
Cost Share Purpose        CPNRD YouTube Videos    UNL Newsletter Article

Groundwater Quality Clearinghouse
The Nebraska Department of Environment & Energy recently launched the Groundwater Quality Clearinghouse website with over 1.6 million sample results from 33,000 irrigation well locations taken by the NRDs. Key features of the map are well locations, nitrate measurements, along with 281 minerals and chemicals whose well compositions were analyzed. The map also showcases aquifer locations, topographic regions and bedrock geology. The site has practical uses for the public. Farmers can check the composition of existing groundwater for chemical content to see how much fertilizer they will need, and gauge which locations have land suitable for raising livestock.
Visit the website at clearinghouse.nebraska.gov

Crop Reporting Website

The Crop Reporting Website is updated with more user-friendly features! Each page of the form is now auto-saved. UNL’s recommended Nitrogen application rates are visible and adjusted as you fill out the form, so you will see the results of each application. And you’ll receive an email receipt when your form is submitted successfully. cpnrd.gisworkshop.com